Python で GUI アプリを作成するときに Qt の Python 用バインディングである PySide (Qt for Python) を使用することが多くなりました。散布図などのチャート作成には、もっぱら matplotlib を使っていますが、他の選択肢も検討しようと、QtCharts というチャート作成用ライブラリの使い方をまとめました。
当初、PySide 用の QtCharts のサンプルが見つからず、C++ 用のサンプル [1] を PySide 用に書き直していましたが、よく探してみると PySide 用サンプルもありました [2]。ここでは、勉強がてら C++ 用のサンプルを書き直したものを紹介していきます。
本記事では、下記の OS 環境を使用しています。
![]() |
Fedora 34 Workstation | x86_64 |
- Python 3.9.6 | ||
- PySide6 6.1.2 (venv) | ||
- IDE: PyCharm 2021.2 (Community Edition) |
BoxWhiskerChart(箱ひげ図)
箱ひげ図(はこひげず、英:box-and-whisker plot)は、データのばらつきをわかりやすく表現するための統計図です。主に多くの水準からなる分布を視覚的に要約し、比較するために用います。箱(box)と、その両側に出たひげ(whisker)で表現されることからこの名があります。
Wikipedia より引用、編集
qtcharts_boxwhiskerchart.py
This file contains bidirectional Unicode text that may be interpreted or compiled differently than what appears below. To review, open the file in an editor that reveals hidden Unicode characters.
Learn more about bidirectional Unicode characters
#!/usr/bin/env python | |
# coding: utf-8 | |
# Reference | |
# https://doc.qt.io/qt-6/qtcharts-boxplotchart-example.html | |
import sys | |
from PySide6.QtCharts import ( | |
QChart, | |
QChartView, | |
QBoxPlotSeries, | |
QBoxSet, | |
) | |
from PySide6.QtCore import Qt | |
from PySide6.QtGui import QPainter | |
from PySide6.QtWidgets import ( | |
QApplication, | |
QMainWindow, | |
) | |
def box_data_reader(name_file: str, name_series: str) -> QBoxPlotSeries: | |
series = QBoxPlotSeries() | |
series.setName(name_series) | |
with open(name_file) as f: | |
for line in f: | |
values = line.strip().split() | |
if len(values) == 0: | |
continue | |
if values[0] == '#': | |
continue | |
boxset = QBoxSet(values[0]) | |
for i in range(1, len(values)): | |
boxset.append(float(values[i])) | |
series.append(boxset) | |
return series | |
class BoxWhiskerChart(QChartView): | |
def __init__(self): | |
super().__init__() | |
chart = self.init_ui() | |
self.setChart(chart) | |
self.setRenderHint(QPainter.Antialiasing) | |
def init_ui(self): | |
series_acme: QBoxPlotSeries = box_data_reader('acme_data.txt', 'Acme Ltd') | |
series_boxwhisk: QBoxPlotSeries = box_data_reader('boxwhisk_data.txt', 'BoxWhisk Inc') | |
chart = QChart() | |
chart.addSeries(series_acme) | |
chart.addSeries(series_boxwhisk) | |
chart.setTitle('Acme Ltd and BoxWhisk Inc share deviation in 2012') | |
chart.setAnimationOptions(QChart.SeriesAnimations) | |
chart.createDefaultAxes() | |
chart.axes(Qt.Vertical)[0].setMin(15.0) | |
chart.axes(Qt.Horizontal)[0].setMax(34.0) | |
chart.legend().setVisible(True) | |
chart.legend().setAlignment(Qt.AlignBottom) | |
return chart | |
class Example(QMainWindow): | |
def __init__(self): | |
super().__init__() | |
boxplot = BoxWhiskerChart() | |
self.setCentralWidget(boxplot) | |
self.resize(700, 400) | |
self.setWindowTitle('Box & Whisker Chart') | |
def main(): | |
app = QApplication(sys.argv) | |
ex = Example() | |
ex.show() | |
sys.exit(app.exec()) | |
if __name__ == '__main__': | |
main() |
本サンプルでは、下記の二つのテキストファイルをプロットするデータとして読み込んでいます。
実行例を下記に示しました。
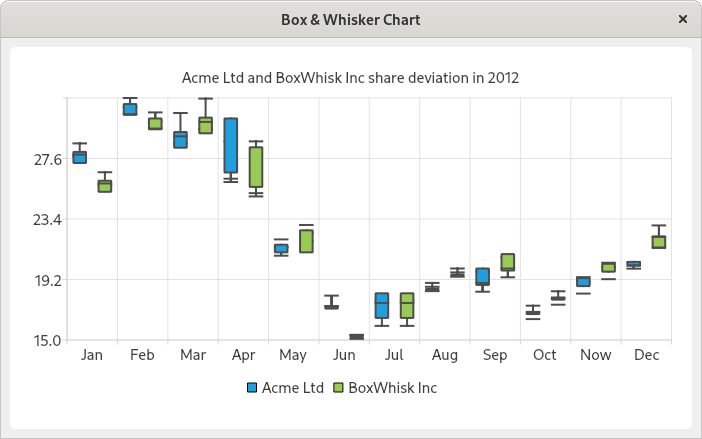
qtcharts_boxwhiskerchart.py の実行例
ファイルを読み込んで、データ列 series への追加は、下記のスタティックメソッドで処理しています。
def box_data_reader(name_file: str, name_series: str) -> QBoxPlotSeries: series = QBoxPlotSeries() series.setName(name_series) with open(name_file) as f: for line in f: values = line.strip().split() if len(values) == 0: continue if values[0] == '#': continue boxset = QBoxSet(values[0]) for i in range(1, len(values)): boxset.append(float(values[i])) series.append(boxset) return series
データ列には QBoxPlotSeries クラス、ボックスプロット用のデータセット作成には QBoxSet クラスのインスタンスを使います。
参考サイト

にほんブログ村
0 件のコメント:
コメントを投稿