Matplotlib は、Python と NumPy のためのプロットライブラリです。Tkinter、wxPython、Qt、GTK のような汎用 GUI ツールキットを使ったアプリケーションにプロットを埋め込むためのオブジェクト指向 API を提供しています。
Wikipedia より引用、翻訳
Matplotlib は、データを可視化する際に大変重宝しています。プロットは Matplotlib で、表(テーブル)は PySide6 で対応できていますが、小さな表をプロットと同様にファイルに出力したい時があります。Matplotlib の table の機能を利用する方法があるので、簡単なサンプルを作成しました。
下記の OS 環境で動作確認をしています。
![]() |
Fedora Workstation 39 | x86_64 |
Python | 3.12.1 | |
pandas | 2.1.4 | |
matplotlib | 3.8.2 |
このサンプルは、データフレームを表にして表示、さらに PDF へ出力します (out.pdf)。
sample_table.py
This file contains bidirectional Unicode text that may be interpreted or compiled differently than what appears below. To review, open the file in an editor that reveals hidden Unicode characters.
Learn more about bidirectional Unicode characters
import pandas as pd | |
import matplotlib.pyplot as plt | |
from matplotlib.backends.backend_pdf import PdfPages | |
df = pd.DataFrame({ | |
'A': [1, 2, 3, 4, 5, 6, 7, 8, 9, 10], | |
'B': [11, 12, 13, 14, 15, 16, 17, 18, 19, 20], | |
'C': [21, 22, 23, 24, 25, 26, 27, 28, 29, 30] | |
}) | |
plt.rcParams['font.family'] = plt.rcParams["font.monospace"][0] | |
fig, ax = plt.subplots(1, 1) | |
ax.table( | |
cellText=df.values, | |
colLabels=df.columns, | |
rowLabels=df.index, | |
loc='center' | |
) | |
ax.axis('tight') | |
ax.axis('off') | |
pp = PdfPages('out.pdf') | |
pp.savefig(fig, bbox_inches='tight') | |
pp.close() | |
plt.show() |
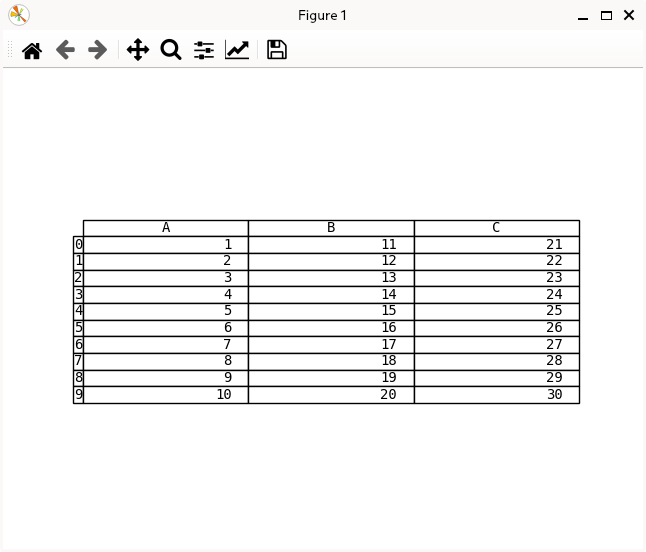
sample_table.py の実行例
まだ表の位置決めに課題が残っていますが、備忘録的に掲載しました。
参考サイト
- matplotlib.pyplot.table — Matplotlib 3.8.2 documentation
- Multipage PDF — Matplotlib 3.8.2 documentation

にほんブログ村
#オープンソース

0 件のコメント:
コメントを投稿