|
#!/usr/bin/env python |
|
# coding: utf-8 |
|
import PySide6 |
|
from PySide6.QtWidgets import ( |
|
QApplication, |
|
QVBoxLayout, |
|
QWidget |
|
) |
|
import sys |
|
import pandas as pd |
|
# Reference |
|
# https://qiita.com/hiroyuki_kageyama/items/cb87a0bee98c0262a35e |
|
import matplotlib |
|
|
|
matplotlib.use('Agg') |
|
import matplotlib.pyplot as plt |
|
from matplotlib.backends.backend_qtagg import FigureCanvasQTAgg as FigureCanvas |
|
from matplotlib.backends.backend_qtagg import NavigationToolbar2QT as NavigationToolbar |
|
|
|
|
|
class Example(QWidget): |
|
def __init__(self): |
|
super().__init__() |
|
self.setWindowTitle('SPC Chart Example') |
|
self.init_ui() |
|
print('PySide6', PySide6.__version__) |
|
print('matplotlib', matplotlib.__version__) |
|
|
|
def init_ui(self): |
|
# Example dataframe |
|
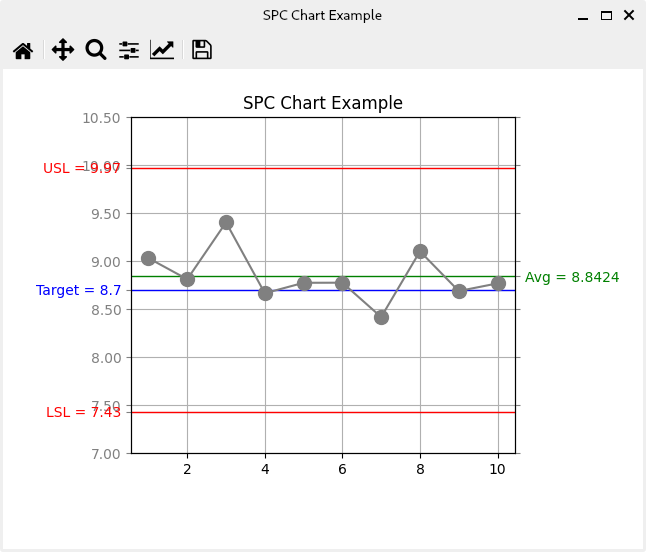
df = pd.DataFrame({ |
|
'Sample': list(range(1, 11)), |
|
'Y': [9.030, 8.810, 9.402, 8.664, 8.773, 8.774, 8.416, 9.101, 8.687, 8.767] |
|
}) |
|
# SPC metrics |
|
spec_usl = 9.97 |
|
spec_target = 8.70 |
|
spec_lsl = 7.43 |
|
value_mean = df.describe().at['mean', 'Y'] |
|
# _/_/_/_/_/_/_/_/_/_/_/_/_/_/_/_/_/_/_/_/_/_/_/_/_/_/_/_/_/_/_/_/_/_/_ |
|
# SPC chart |
|
fig = plt.figure(dpi=100) |
|
ax = fig.add_subplot(111, title=self.windowTitle()) |
|
plt.subplots_adjust(bottom=0.2, left=0.2, right=0.8, top=0.9) |
|
ax.grid(True) |
|
# Horizontal Lines for SPC metrics |
|
ax.axhline(y=spec_usl, linewidth=1, color='red', label='USL') |
|
ax.axhline(y=spec_target, linewidth=1, color='blue', label='Target') |
|
ax.axhline(y=spec_lsl, linewidth=1, color='red', label='LSL') |
|
ax.axhline(y=value_mean, linewidth=1, color='green', label='Avg') |
|
# Trend |
|
ax.plot(df['Sample'], df['Y'], color="gray", marker="o", markersize=10) |
|
ax.yaxis.label.set_color('gray') |
|
ax.tick_params(axis='y', colors='gray') |
|
# add extra ticks |
|
extraticks = [spec_lsl, spec_target, spec_usl] |
|
ax.set_yticks(list(ax.get_yticks()) + extraticks) |
|
fig.canvas.draw() |
|
# Labels |
|
labels = [item.get_text() for item in ax.get_yticklabels()] |
|
n = len(labels) |
|
labels[n - 3] = 'LSL = ' + str(spec_lsl) |
|
labels[n - 2] = 'Target = ' + str(spec_target) |
|
labels[n - 1] = 'USL = ' + str(spec_usl) |
|
ax.set_yticklabels(labels) |
|
# Color |
|
yticklabels = ax.get_yticklabels() |
|
n = len(yticklabels) |
|
yticklabels[n - 3].set_color('red') |
|
yticklabels[n - 2].set_color('blue') |
|
yticklabels[n - 1].set_color('red') |
|
# add second y axis wish same range as first y axis |
|
ax2 = ax.twinx() |
|
ax2.set_ylim(ax.get_ylim()) |
|
ax2.tick_params(axis='y', colors='gray') |
|
# add extra ticks |
|
extraticks2 = [value_mean] |
|
ax2.set_yticks(list(ax2.get_yticks()) + extraticks2) |
|
# Label for second y axis |
|
labels2 = [item.get_text() for item in ax2.get_yticklabels()] |
|
n = len(labels2) |
|
labels2[n - 1] = 'Avg = ' + str(value_mean) |
|
ax2.set_yticklabels(labels2) |
|
# Color for second y axis |
|
yticklabels2 = ax2.get_yticklabels() |
|
n = len(yticklabels2) |
|
yticklabels2[n - 1].set_color('green') |
|
# _/_/_/_/_/_/_/_/_/_/_/_/_/_/_/_/_/_/_/_/_/_/_/_/_/_/_/_/_/_/_/_/_/_/_ |
|
# Canvas & Toolbar |
|
canvas = FigureCanvas(fig) |
|
toolbar = NavigationToolbar(canvas, self) |
|
unwanted_buttons = ['Back', 'Forward'] |
|
for x in toolbar.actions(): |
|
if x.text() in unwanted_buttons: |
|
toolbar.removeAction(x) |
|
# _/_/_/_/_/_/_/_/_/_/_/_/_/_/_/_/_/_/_/_/_/_/_/_/_/_/_/_/_/_/_/_/_/_/_ |
|
# Layout |
|
layout = QVBoxLayout(self) |
|
layout.setContentsMargins(0, 0, 0, 0) |
|
layout.setSpacing(0) |
|
layout.addWidget(toolbar) |
|
layout.addWidget(canvas) |
|
|
|
|
|
def main(): |
|
app = QApplication(sys.argv) |
|
ex = Example() |
|
ex.show() |
|
sys.exit(app.exec()) |
|
|
|
|
|
if __name__ == '__main__': |
|
main() |