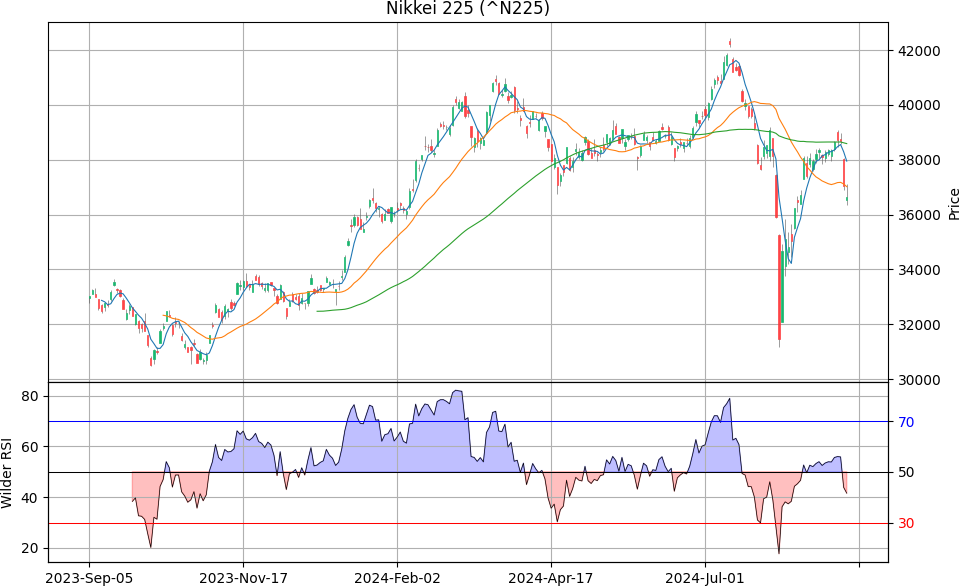
RSI, Relative Strength Index は、相場の過熱感を 0% - 100% で表したオシレーター系のテクニカル指標です。J・ウエルズ・ワイルダー・ジュニア氏 (J. Welles Wilder, Jr.) が考案者で、1978年に発表されました。日本語では、「相対力指数」と呼ばれます。
RSI の数値が 70% 以上では「買われすぎ」を意味し、30% 以下では「売られすぎ」を意味します。
算出方法は
RSI = 値上がり幅の指数移動平均(α) ÷ (値上がり幅の指数移動平均(α) + 値下がり幅の指数移動平均(α)) × 100
α = 1/14 を使うことをワイルダーは推奨しています。つまり、14 日の修正移動平均です。
先月 8 月 5 日の東京市場の歴史的な暴落を経験して、今さらながら先達が開発したテクニカル分析の手法を、自分でもプログラムを作って分析できるようにしようと思い、いろいろ調べています。
今回は上記 RSI です。
下記の OS 環境で動作確認をしています。

|
RHEL 9.4 | x86_64 |
| Python | 3.12.1 | |
| jupyterlab | 4.2.5 | |
| matplotlib | 3.9.2 | |
| mplfinance | 0.12.10b0 | |
| pandas | 2.2.2 | |
| yfinance | 0.2.43 |
以下の作業は JupyterLab 上でおこなっています。
まず、必要なパッケージをインポートします。
import matplotlib.pyplot as plt
import mplfinance as mpf
import pandas as pd
import yfinance as yf
Wilder の RSI を算出する関数です。参考サイト [1] で公開されている Python のコードを流用させていただきました。
def wilder_rsi(ohlc: pd.DataFrame, period: int = 14) -> pd.Series:
    delta = ohlc['Close'].diff()

    up, down = delta.copy(), delta.copy()
    up[up < 0] = 0
    down[down > 0] = 0

    _gain = up.ewm(com=(period - 1), min_periods=period).mean()
    _loss = down.abs().ewm(com=(period - 1), min_periods=period).mean()

    rs = _gain / _loss
    return pd.Series(100 - (100 / (1 + rs)), name='RSI')
過去1年分の日経平均株価 (^N225) の日足データを取得します。
symbol = '^N225'
ticker = yf.Ticker(symbol)
df = ticker.history(period='1y')
mplfinance でローソク足チャートとその移動平均(5 日, 25 日, 75 日)をプロットし、その下の二番目の領域に RSI をプロットします。チャートに手を加えたかったので mplfinance にプロットの全てを任せず、わざわざ matplotlib で扱えるようにしています。
# Wilder RSI
rsi = wilder_rsi(df)

fig, ax = plt.subplots(
    2, 1,
    gridspec_kw=dict(height_ratios=[2, 1], hspace=0),
    sharex=True, figsize=(12, 6)
)

apd_osc = [
    mpf.make_addplot(rsi, ylabel='RSI', color='black', width=0.5, ax=ax[1])
]

mpf.plot(
    df,
    type='candle',
    style='yahoo',
    mav=(5, 25, 75),
    addplot=apd_osc,
    ax=ax[0],
)

ax[0].set_title('%s (%s)' % (ticker.info['longName'], symbol))
ax[0].grid('both')

fb_rsi_up = dict(x=range(len(rsi)), y1=rsi.values, y2=50, where=50<rsi, color='blue', alpha=0.25, interpolate=True)
fb_rsi_dn = dict(x=range(len(rsi)), y1=rsi.values, y2=50, where=50>rsi, color='red', alpha=0.25, interpolate=True)
ax[1].fill_between(**fb_rsi_up)
ax[1].fill_between(**fb_rsi_dn)

ax[1].set_ylabel('Wilder RSI')
ax[1].grid('both')

ax2 = ax[1].twinx()
ax2.set_ylim(ax[1].get_ylim())
ax2.tick_params(axis='y')
ax2.set_yticks([30, 50, 70])
yticklabels2 = ax2.get_yticklabels()
yticklabels2[0].set_color('red')
yticklabels2[1].set_color('black')
yticklabels2[2].set_color('blue')
ax2.axhline(y=30, color='red', linewidth=0.75, linestyle='solid')
ax2.axhline(y=50, color='black', linewidth=0.75, linestyle='solid')
ax2.axhline(y=70, color='blue', linewidth=0.75, linestyle='solid')

plt.subplots_adjust(left=0.15, right=0.85, bottom=0.05, top=0.95)
# plt.savefig('rsi_wilder_n225.png')
plt.show()
RSI をただプロットするだけでは味気ないので、(実用的かどうかは別として)いろいろ修飾してみました。💦
参考サイト
- RSI calculation to match Tradingview
- RSI には2つの計算式があるけれど違いは何か [2023-09-26]
- bitWalk's: 【備忘録】モメンタムとボリンジャーバンド [2024-08-10]
- bitWalk's: 【備忘録】フィボナッチ・リトレースメント [2024-08-12]
- bitWalk's: 【備忘録】一目均衡表 [2024-08-15]
にほんブログ村
#オープンソース


0 件のコメント:
コメントを投稿