PySide (Qt for Python) は、Qt(キュート)の Python バインディングで、GUI などを構築するためのクロスプラットフォームなライブラリです。Linux/X11, macOS および Microsoft Windows をサポートしています。配布ライセンスは LGPL で公開されています。
Matplotlib のチャートを PySide6 に GUI に埋め込んで利用しています。リアルタイムに…、と言っても更新頻度は数秒に一回程度なのですが、データを取得して Matplotlib のチャートに反映させるときは、表示されているチャートを一旦消してから書き直しています。この程度の更新頻度であれば、チャートを書き直しても問題ありませんが、もっと更新頻度が高いときに、チャートを書き直さずにチャート上に新しいデータ点を追加する方法を確認しておきたくなりました。
下記の OS 環境で動作確認をしています。
![]() |
RHEL 9.4 | x86_64 |
Python | 3.12.1 | |
PySide6 | 6.7.1 | |
matplotlib | 3.9.0 |
次のサンプルは、タイマーで 50 ミリ秒毎にイベントを発生させて、タイムスタンプとその値で計算した正弦曲線 (Sin) を描画します(最大 1,000 点)。点と点を描画するだけでなく、点と点を直線で結びたかったので、前の点の座標を保持しておき、表示上は擬似的な正弦曲線に見えるようにしています。
qt_matplotlib_realtime.py
This file contains bidirectional Unicode text that may be interpreted or compiled differently than what appears below. To review, open the file in an editor that reveals hidden Unicode characters.
Learn more about bidirectional Unicode characters
import datetime | |
import math | |
import sys | |
import pandas as pd | |
from PySide6.QtCore import Qt, QTimer | |
from PySide6.QtWidgets import ( | |
QApplication, | |
QMainWindow, | |
) | |
from matplotlib.backends.backend_qtagg import FigureCanvasQTAgg as FigureCanvas | |
from matplotlib.backends.backend_qtagg import NavigationToolbar2QT as NavigationToolbar | |
from matplotlib.figure import Figure | |
class RTChart(FigureCanvas): | |
def __init__(self): | |
self.fig = Figure() | |
super().__init__(self.fig) | |
self.ax = ax = self.fig.add_subplot(111) | |
ax.set(title='Sample') | |
ax.set_ylabel('Y') | |
ax.grid(True) | |
class Example(QMainWindow): | |
def __init__(self): | |
super().__init__() | |
self.setWindowTitle('Real Time Sample') | |
self.resize(600, 400) | |
self.t0 = None | |
self.y0 = None | |
self.count = 0 | |
self.canvas = canvas = RTChart() | |
self.setCentralWidget(canvas) | |
toolbar = NavigationToolbar(canvas, self) | |
self.addToolBar(Qt.ToolBarArea.BottomToolBarArea, toolbar) | |
self.timer = timer = QTimer(self) | |
timer.timeout.connect(self.update_data) | |
timer.start(50) | |
def update_data(self): | |
if self.count > 1000: | |
self.timer.stop() | |
print('completed!') | |
return | |
t1 = datetime.datetime.now() | |
y1 = math.sin(t1.timestamp()) | |
if self.t0 is not None: | |
self.canvas.ax.plot( | |
[self.t0, t1], [self.y0, y1], color='C1', | |
linewidth=1, marker='o', markersize=2) | |
self.canvas.fig.canvas.draw() | |
self.t0 = t1 | |
self.y0 = y1 | |
self.count += 1 | |
def main(): | |
app = QApplication(sys.argv) | |
ex = Example() | |
ex.show() | |
sys.exit(app.exec()) | |
if __name__ == '__main__': | |
main() |
このサンプルを実行した例を示しました。x 軸の時刻表示については改善の余地があります。🙇🏻
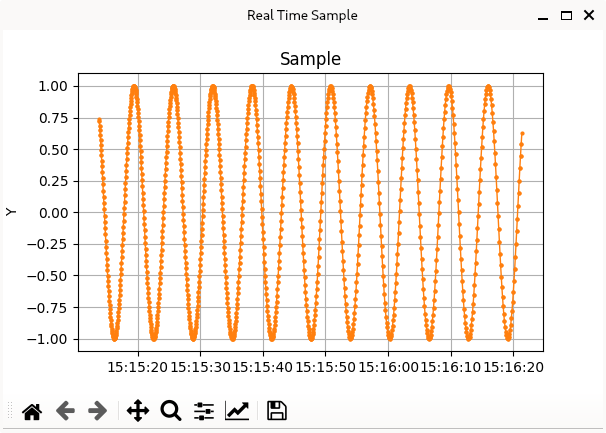
qt_matplotlib_realtime.py の実行例
completed!
このサンプルでは、タイマーのイベントが発生する度にカウンタの値を増やし、1000 回になったところでタイマーを止めています。
参考サイト
- matplotlib.pyplot.plot — Matplotlib documentation
- Embedding in Qt — Matplotlib documentation
- QTimer - Qt for Python

にほんブログ村
#オープンソース

0 件のコメント:
コメントを投稿