PySide (Qt for Python) は、Qt(キュート)の Python バインディングで、GUI などを構築するためのクロスプラットフォームなライブラリです。配布ライセンスは LGPL で公開されています。
Matplotlib は Python およびその科学計算用ライブラリ NumPy のためのグラフ描画ライブラリです。Jupyter Notebook 上で利用できるばかりでなく、PySide6 / PyQt6 のような GUI ツールキットでも利用できるので、大変重宝しています。
Python と組み合わせる GUI ツールキットは、最近もっぱら PySide6 を利用していますが、場当たり的に Matplotlib でプロットを作成するので収集がつかなくなり、Matplotlib で描画するプロットもクラスで管理すべきと思うようになりました。
さてどうするか。
Figure (matplotlib.figure) を継承するか、FigureCanvas (matplotlib.backends.backend_qtagg,FigureCanvasQTAgg) にするか、それともそれぞれ継承したクラスを作るべきか…。
あれこれ考えた結果、FigureCanvas を継承したクラスを用意してプロットを管理することにしました。
簡単なサンプルを用意したつもりですが、なんだか冗長なように見えるかもしれません。しかし、いくつも同じようなプロットを作成するアプリの場合には管理がシンプルになります。
下記の OS 環境で動作確認をしました。
![]() |
Fedora Linux 36 beta | x86_64 |
Python | 3.10.4 | |
PySide6 | 6.2.4 | |
matplotlib | 3.5.1 |
qt_matplotlib_scatter.py
This file contains bidirectional Unicode text that may be interpreted or compiled differently than what appears below. To review, open the file in an editor that reveals hidden Unicode characters.
Learn more about bidirectional Unicode characters
#!/usr/bin/env python | |
# coding: utf-8 | |
from PySide6.QtCore import Qt | |
from PySide6.QtWidgets import QApplication, QMainWindow | |
import sys | |
import numpy as np | |
import pandas as pd | |
import matplotlib.pyplot as plt | |
from matplotlib.backends.backend_qtagg import FigureCanvasQTAgg as FigureCanvas | |
from matplotlib.backends.backend_qtagg import NavigationToolbar2QT as NavigationToolbar | |
from matplotlib.figure import Figure | |
from matplotlib.widgets import EllipseSelector, RectangleSelector | |
import seaborn as sns | |
class Scatter(FigureCanvas): | |
df: pd.DataFrame = None | |
fig = Figure() | |
def __init__(self, df: pd.DataFrame): | |
super().__init__(self.fig) | |
self.df = df | |
ax = self.init_chart() | |
# Selector | |
plt.RS = RectangleSelector( | |
ax, self.selection, useblit=True, | |
button=[1], # disable middle & right buttons | |
minspanx=5, minspany=5, spancoords='pixels', interactive=True, | |
props=dict(facecolor='pink', edgecolor='red', alpha=0.2, fill=True) | |
) | |
def init_chart(self): | |
# Seaborn Scatter | |
ax = sns.scatterplot( | |
data=self.df, x=self.df.columns[0], y=self.df.columns[1], | |
ax=self.fig.add_subplot(111) | |
) | |
return ax | |
@staticmethod | |
def selection(eclick, erelease): | |
x1, y1 = eclick.xdata, eclick.ydata | |
x2, y2 = erelease.xdata, erelease.ydata | |
print(f"({x1: 3.2f}, {y1: 3.2f}) --> ({x2: 3.2f}, {y2: 3.2f})") | |
class ScatterTest(Scatter): | |
title: str = None | |
def __init__(self, df: pd.DataFrame): | |
self.title = 'Scatter Sample' | |
super().__init__(df) | |
def init_chart(self): | |
# Seaborn Scatter | |
ax = sns.scatterplot( | |
data=self.df, x=self.df.columns[0], y=self.df.columns[1], | |
ax=self.fig.add_subplot(111) | |
) | |
ax.set(title=self.title) | |
return ax | |
class Example(QMainWindow): | |
def __init__(self): | |
super().__init__() | |
self.setWindowTitle('Scatter example') | |
self.init_ui() | |
def init_ui(self): | |
# sample data | |
df = pd.DataFrame(np.random.random(size=(100, 2)), columns=['X', 'Y']) | |
# chart | |
canvas: FigureCanvas = ScatterTest(df) | |
self.setCentralWidget(canvas) | |
# navigation for plot | |
navtoolbar = NavigationToolbar(canvas, self) | |
self.addToolBar(Qt.BottomToolBarArea, navtoolbar) | |
def main(): | |
app = QApplication(sys.argv) | |
ex = Example() | |
ex.show() | |
sys.exit(app.exec()) | |
if __name__ == '__main__': | |
main() |
このサンプルの実行例を以下に示しました。
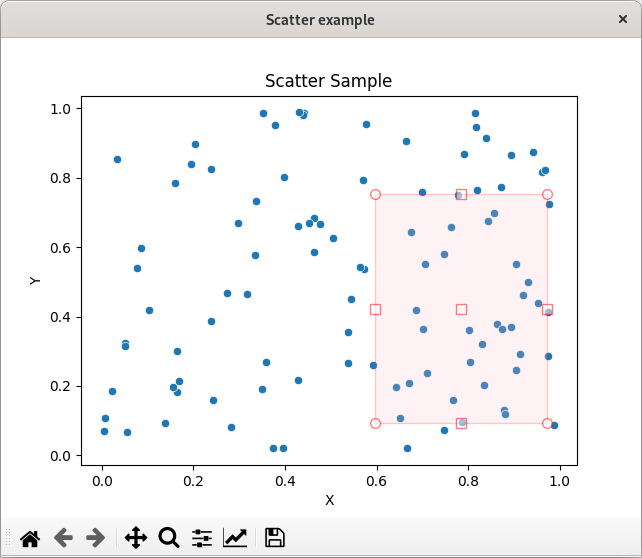
qt_matplotlib_scatter.py の実行例
( 0.60, 0.09) --> ( 0.97, 0.75)
参考サイト

にほんブログ村
0 件のコメント:
コメントを投稿