
VBA, Visual Basic for Applications は、マイクロソフト社が Microsoft Visual Basic を、同社製品の Microsoft Office に搭載したものです。VBA を使用することで、Excel、Access、Word、Outlook、PowerPoint など、Office のアプリケーション・ソフトウェアの機能をカスタマイズしたり、拡張したりすることができます。
Excel で Parabolic SAR を算出(配列版)
前回、VBA で Parabolic SAR の算出するために、Range オブジェクトで計算に必要な情報が含まれる範囲を指定して処理へ渡しました(過去記事 [1])。
今回は、Range オブジェクトを処理へ渡す代わりに配列を渡す方法に変えて、処理時間をベンチマークして比較しました。結論を先に言ってしまえば、配列を使った方がやっぱり処理が早かったです。
下記の OS 環境で動作確認をしています。

|
Microsoft Windows 11 Home | 24H2 |
| Microsoft Excel 2024 MSO | 64 ビット |
VBA でのアプローチ
考え方は前回と同じで、Parabolic SAR の算出に必要な範囲を処理に渡すのですが、今回は Range オブジェクトから Variant 配列へ移してから処理に渡します。
前回と同じように、VBAProjects の標準モジュール内に ModPSAR というモジュールを挿入し、2つのマクロ calc_PSAR_1(最初の行の計算用)と calc_PSAR_2(その他の行の計算用)を作りました。
以下が、前回の「Range オブジェクト渡し」から「配列渡し」へ変更した PSAR を算出するコードです。前回と同じアルゴリズムですが、配列を扱うことで .Value を付加する必要がなくなった分、すっきりしたコードになりました。
Option Explicit

' Column information
Private Const P_HIGH As Integer = 1
Private Const P_LOW As Integer = 2
Private Const P_CLOSE As Integer = 3

Private Const TREND As Integer = 5
Private Const EP As Integer = 6
Private Const AF As Integer = 7
Private Const PSAR As Integer = 8

' Parameters for Parabolic SAR
Private Const AF_INIT As Double = 0.02
Private Const AF_STEP As Double = 0.02
Private Const AF_MAX As Double = 0.2


'
' PSAR calculation for the 1st row of data
'
Sub calc_PSAR_1(ByRef arr As Variant)


    ' TREND
    If arr(2, P_CLOSE) > arr(1, P_CLOSE) Then
        arr(2, TREND) = 1
    Else
        arr(2, TREND) = -1
    End If

    ' EP, the extreme point
    If arr(2, TREND) = 1 Then
        arr(2, EP) = arr(2, P_HIGH)
    Else
        arr(2, EP) = arr(2, P_LOW)
    End If

    ' AF, the acceleration factor
    arr(2, AF) = AF_INIT

    ' PSAR
    If arr(2, TREND) = 1 Then
        arr(2, PSAR) = arr(2, P_HIGH)
    Else
        arr(2, PSAR) = arr(2, P_LOW)
    End If

End Sub


'
' Parabolic SAR calculation for row of data other than the 1st row
'
Sub calc_PSAR_2(ByRef arr As Variant)

    ' TREND
    If arr(1, TREND) = 1 Then
        If arr(1, PSAR) > arr(2, P_LOW) Then
            arr(2, TREND) = -1
        Else
            arr(2, TREND) = 1
        End If
    Else
        If arr(1, PSAR) < arr(2, P_HIGH) Then
            arr(2, TREND) = 1
        Else
            arr(2, TREND) = -1
        End If
    End If

    ' EP, the extreme point
    If arr(2, TREND) = 1 Then
        If arr(1, PSAR) > arr(2, P_LOW) Then
            arr(2, EP) = arr(2, P_LOW)
        ElseIf arr(2, P_HIGH) > arr(1, EP) Then
            arr(2, EP) = arr(2, P_HIGH)
        Else
            arr(2, EP) = arr(1, EP)
        End If
    Else
        If arr(1, PSAR) < arr(2, P_HIGH) Then
            arr(2, EP) = arr(2, P_HIGH)
        ElseIf arr(2, P_LOW) < arr(1, EP) Then
            arr(2, EP) = arr(2, P_LOW)
        Else
            arr(2, EP) = arr(1, EP)
        End If
    End If

    ' AF, the acceleration factor
    If arr(2, TREND) <> arr(1, TREND) Then
        arr(2, AF) = AF_INIT
    Else
        If arr(2, EP) <> arr(1, EP) And arr(1, AF) < AF_MAX Then
            arr(2, AF) = arr(1, AF) + AF_STEP
        Else
            arr(2, AF) = arr(1, AF)
        End If
    End If

    ' PSAR
    If arr(2, TREND) = arr(1, TREND) Then
        arr(2, PSAR) = arr(1, PSAR) + arr(2, AF) * (arr(2, EP) - arr(1, PSAR))
    Else
        arr(2, PSAR) = arr(1, EP)
    End If

End Sub
動作確認
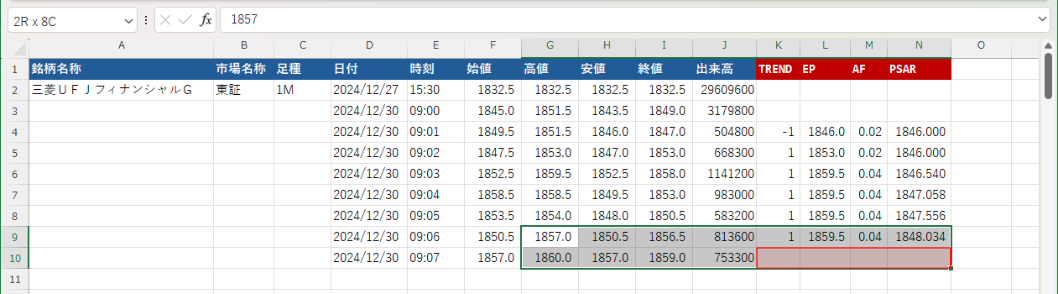
下記のワークシートのマクロで動作確認をしました。一旦 Range で指定した範囲を Variant 型の配列へコピーして Parabolic SAR の計算。計算が終わったら同じ Range で指定した範囲へ戻しています。
' Column information
Private Const P_HIGH As Integer = 7
Private Const P_LOW As Integer = 8
Private Const P_CLOSE As Integer = 9

Private Const TREND As Integer = 11
Private Const EP As Integer = 12
Private Const AF As Integer = 13
Private Const PSAR As Integer = 14


'
' Parabolic SAR のテスト
'
Sub TestPSAR()
    Dim i As Integer
    Dim row_1 As Integer
    Dim array_PSAR As Variant

    row_1 = 3
    For i = row_1 To row_1 + 323

        array_PSAR = Range(Cells(i, P_HIGH), Cells(i + 1, PSAR)).Value
        If i = row_1 Then
            Call calc_PSAR_1(array_PSAR)
        Else
            Call calc_PSAR_2(array_PSAR)
        End If
        Range(Cells(i, P_HIGH), Cells(i + 1, PSAR)).Value = array_PSAR

    Next i

End Sub
ベンチマーク
前回と同じく、ベンチマークを計測しました。100 回算出した平均値を出力しています。
'
' ベンチマーク
'
Sub Benchmark()
    Const REPEAT_MAX As Integer = 100
    Dim i As Integer
    Dim timeStart As Double
    Dim timeEnd As Double

    timeStart = Timer
    Do While i < REPEAT_MAX
        Call TestPSAR
        i = i + 1
    Loop
    timeEnd = Timer

    Debug.Print (timeEnd - timeStart) / REPEAT_MAX
End Sub
0.05849609375
Range オブジェクトを使った前回は、同じベンチマークで約 0.185 秒かかっていたので、配列にすることで 3 倍ちょっと処理が早くなりました。
短い時間を扱っているので時間差で見ると僅かかもしれませんが、3 倍の差は大きいです。本体アプリも配列への変更に取り掛かる必要が出てきました。
サンプルシート
以上のコード、シートを含む Excel ファイルを下記からダウンロードできます。ご参考まで。

|
sample_psar_2.xlsm |
参考サイト
- bitWalk's: 【備忘録】Excel VBA で Parabolic SAR を算出 [2024-12-31]
にほんブログ村

#オープンソース

0 件のコメント:
コメントを投稿